


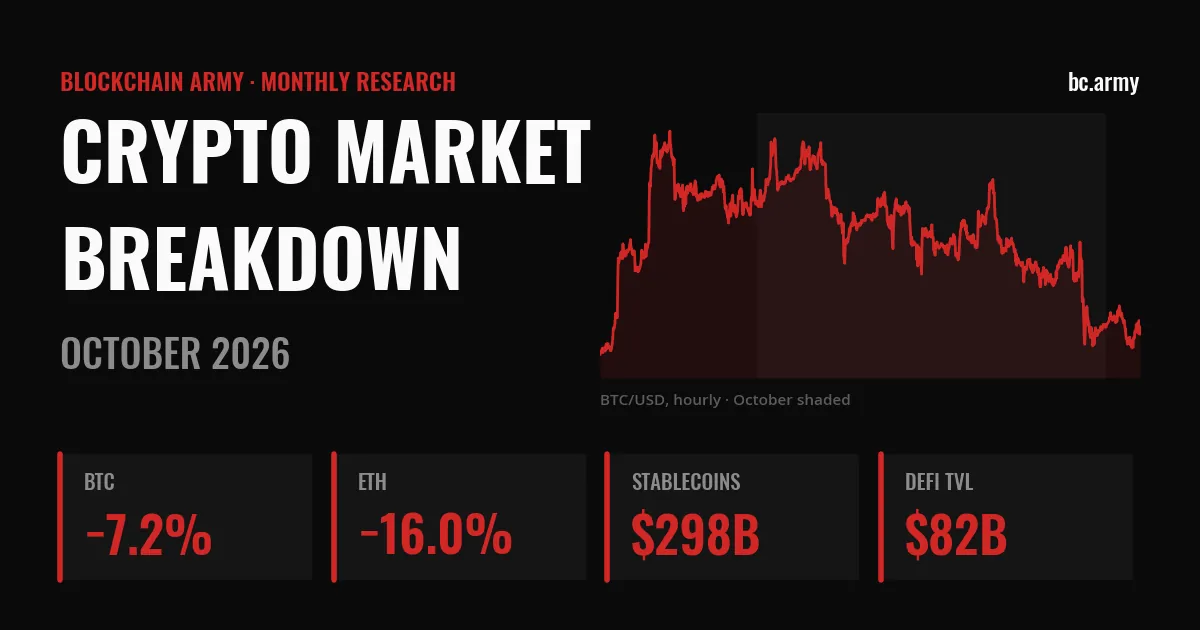
October has a reputation in crypto. This one did not live up to it. Bitcoin closed the month 7.2% lower, Ether lost 16.0%, and 18 of the 20 largest crypto assets finished in the red. The month was a slow grind lower, with a hot inflation print and hawkish Fed dissents along the way, until a record exploit at the largest exchange broke it on October 29.
This is the first edition of our monthly Crypto Market Breakdown. Every chart below is built from public, keyless data (CoinGecko, DefiLlama, mempool.space, Blockchain.com, ultrasound.money and Alternative.me), processed by our own pipeline. Each chart states its source and the time the data was pulled. The methodology is at the end.
Executive summary
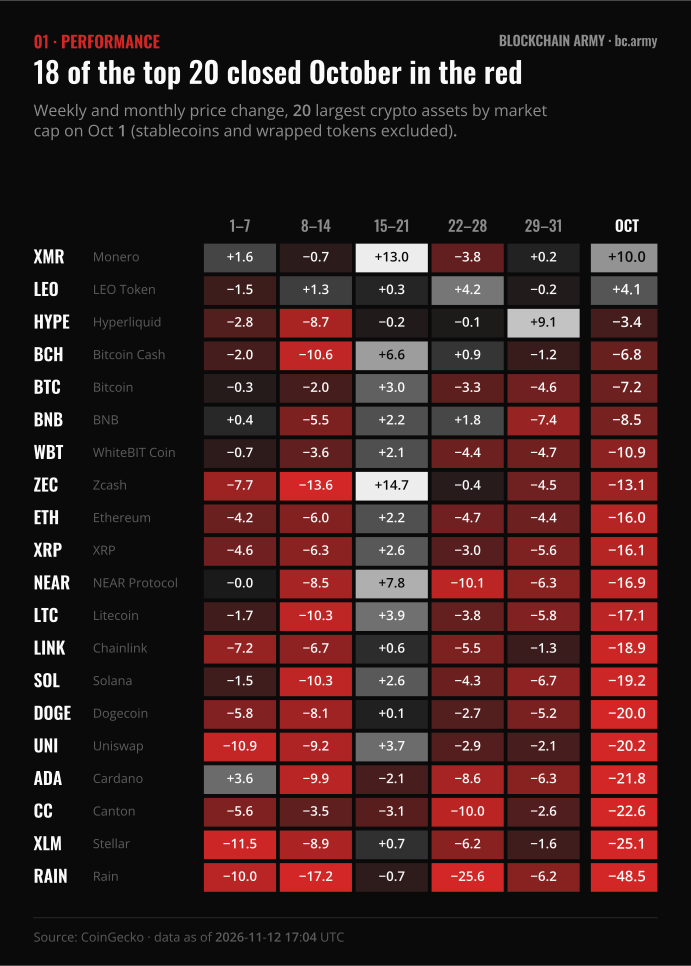
- A broad, grinding decline. BTC went from $83,576 to $77,521 (-7.2%) and ETH from $2,685 to $2,254 (-16.0%). The median return across the top 20 assets was -16.5%. Only Monero (+10.0%) and LEO (+4.1%) finished higher.
- The Binance exploit was the month's defining event. About $6.3 billion was drained from Binance hot wallets on October 29. In the window that contains the exploit, the on-chain assets DefiLlama tracks for Binance fell $11.7 billion (-8.1%), against -3.4% to -6.8% at OKX, Bybit and Bitfinex.
- Stablecoin supply contracted. Total stablecoin market cap fell $7.2 billion (-2.3%) to $298.1 billion. USDT (-$4.2 billion) and USDC (-$2.3 billion) accounted for most of the drop.
- Less on-chain activity. DeFi TVL fell 10.9% to $82.3 billion and spot DEX volume dropped 17.4% to $258.3 billion. Ethereum (+12.5%) and Base (+9.0%) gained DEX share while Solana fell 23.0%.
- Miners kept investing. Hashrate averaged 1,024 EH/s, up 8.4% on September, and difficulty rose about 11.8% across three adjustments. Fees paid to miners were just 82.85 BTC for the whole month.
Key takeaway: October was a liquidity story before it was a security story. Stablecoin supply, ETF flows and on-chain volumes were already shrinking before the Binance exploit. The exploit sped up a de-risking that was already under way; it did not start it.
Performance: 18 of the top 20 in the red
 Source: CoinGecko, Blockchain Army calculation, data as of 2026-11-12 17:04 UTC
The weekly columns show how the decline unfolded. The second week (October 8-14) was the worst for most large caps: Solana, Litecoin and Bitcoin Cash all lost more than 10%. The third week (October 15-21) was the only broad relief rally: BTC gained 3.0%, Zcash 14.7% and Monero 13.0%. The last stretch (October 29-31), which includes the exploit, was negative for 17 of the 20 assets.
At the bottom of the table, RAIN lost 48.5% and Stellar 25.1%. Large caps with heavy retail and DeFi exposure (SOL -19.2%, DOGE -20.0%, UNI -20.2%, ADA -21.8%) fell more than twice as much as Bitcoin. Hyperliquid's HYPE (-3.4%) held up well among the venue tokens, helped by a +9.1% final stretch.
Price action: a grind, then a break
 Source: CoinGecko, data as of 2026-11-12 17:04 UTC; events per the reports cited below
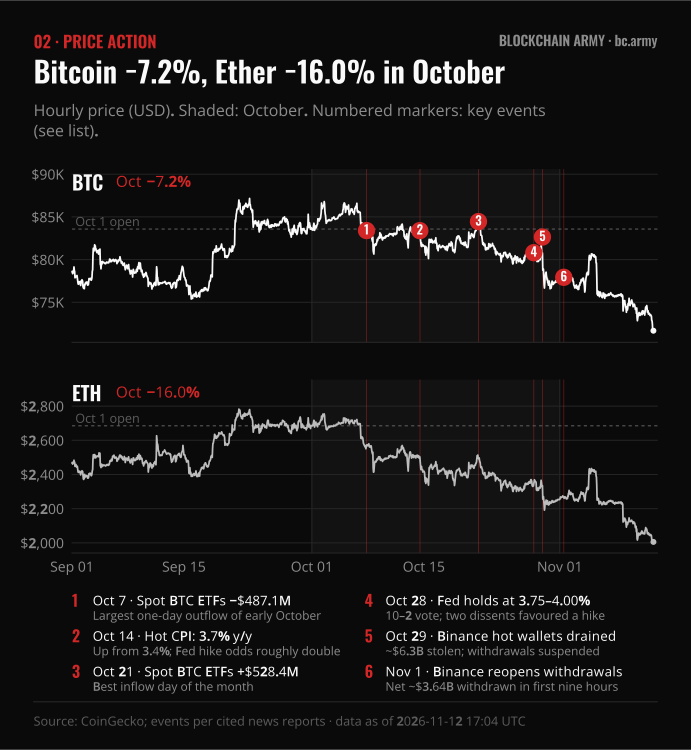
Bitcoin's highest daily close of the month came early ($86,490 on October 4). The sell-off started in the second week, alongside heavy ETF redemptions: spot Bitcoin ETFs lost $487.1 million on October 7 alone, according to Crypto Briefing. On October 14, September CPI came in at 3.7% year on year, above the 3.6% consensus. Decrypt reported that the odds of a rate hike at the October meeting roughly doubled after the release. On October 28 the Fed held rates at 3.75-4.00%, but two voters dissented in favour of a hike (investingLive).
Then came October 29. Starting around 20:05 UTC, attackers drained about $6.3 billion from Binance hot wallets across several chains, the largest crypto theft on record. The attacker used an EIP-7702 delegation to take control of a hot wallet without passing normal approval controls, according to Cointelegraph's recap. The next day, a tech-led equity sell-off added to the pressure: the Nasdaq fell 2.5% after weak guidance from Intel, and Bitcoin hit its lowest level since mid-September (Cointelegraph). Bitcoin's lowest daily close of the month was $77,275 on October 30.
Ether did worse than Bitcoin all month. The ETH/BTC ratio fell from 0.0321 to 0.0291 (-9.5%), and US spot Ether ETFs lost more than $1 billion in October by the 21st alone (Cointelegraph). Spot Bitcoin ETFs ended the month with net outflows of $515.0 million through October 30, per Simple Mining's tally. The split between funds is notable: BlackRock's IBIT took in $931.8 million while all other funds combined lost $1.45 billion.
Sectors: no sector basket finished positive
 Source: CoinGecko categories, Blockchain Army calculation, data as of 2026-11-12 17:04 UTC
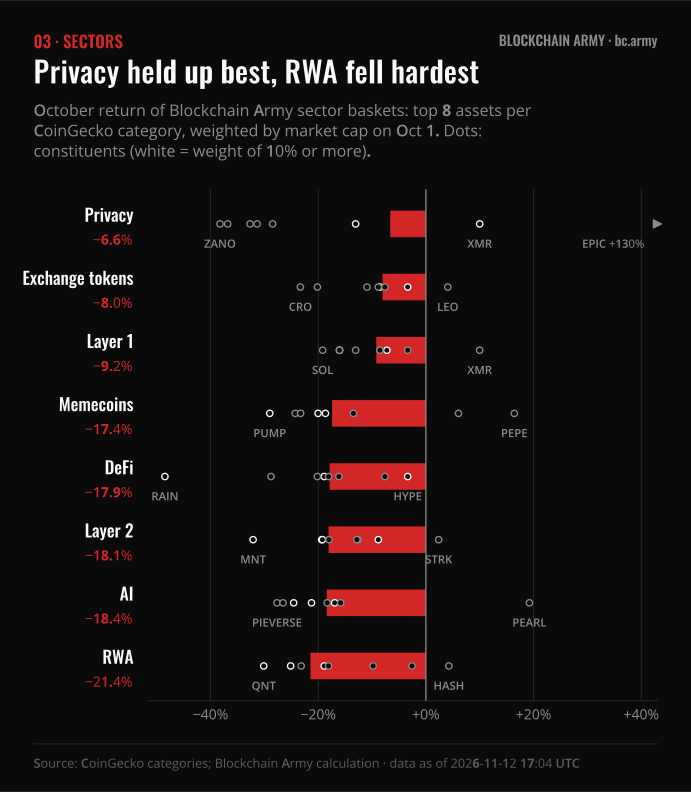
We built eight sector baskets from CoinGecko categories. Each holds the eight largest assets in its category, weighted by market cap on October 1. None of them finished October in positive territory. Privacy fell least (-6.6%), but that figure hides a split: Zcash (69% of the basket) fell 13.1% after its long run, while Monero rose 10.0%. Exchange tokens (-8.0%) and the Bitcoin-heavy Layer 1 basket (-9.2%) did better than the more speculative sectors.
The rest of the market fell together. Memecoins (-17.4%), DeFi (-17.9%), Layer 2 (-18.1%), AI (-18.4%) and RWA (-21.4%) all landed within four percentage points of each other. The constituent dots show that almost nothing inside those baskets bucked the trend. When return dispersion is this low, the market is trading beta and liquidity, not individual project news.
Liquidity: stablecoin supply shrank by $7.2 billion
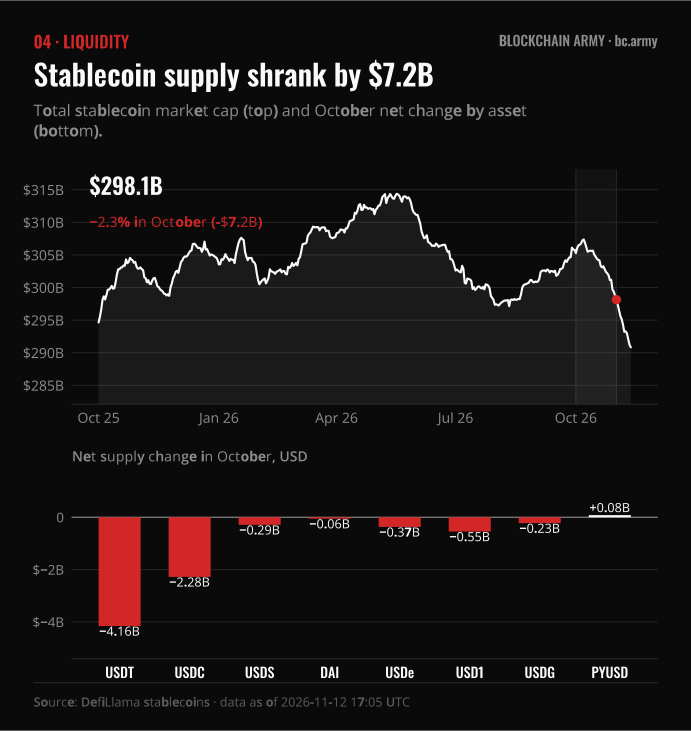 Source: DefiLlama, data as of 2026-11-12 17:05 UTC
Stablecoins are the closest thing crypto has to a measure of dry powder, and in October that supply went down. Total stablecoin market cap fell from $305.3 billion to $298.1 billion. That left it only 1.2% above its level a year earlier. USDT shrank by $4.16 billion and USDC by $2.28 billion. USD1 (-$0.55 billion), USDe (-$0.37 billion) and USDS (-$0.29 billion) also contracted. Among the larger issuers, only Falcon's USDf (+$0.46 billion), PayPal's PYUSD (+$0.08 billion) and Ripple's RLUSD grew.
The timing matters. USDT supply peaked around October 9 and fell almost every day afterwards. The decline started well before the exploit and continued after it: by November 12, USDT stood at $175.6 billion, another $4 billion lower. Net redemptions on this scale mean capital is leaving the system, not just moving between tokens.
Key takeaway: Net stablecoin issuance has historically gone hand in hand with crypto rallies. A second month of net redemptions would be the clearest on-chain sign that buyers are still stepping back.
DeFi: TVL down 10.9% to $82.3 billion
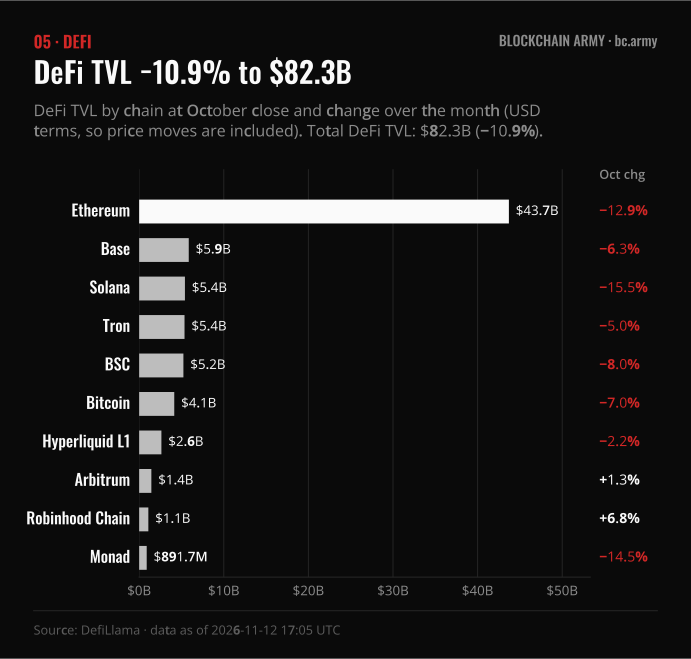 Source: DefiLlama, data as of 2026-11-12 17:05 UTC
Total DeFi TVL fell from $92.4 billion to $82.3 billion. TVL is measured in US dollars, so most of the drop reflects lower prices rather than withdrawals. Ethereum still holds 53% of all DeFi TVL ($43.7 billion, -12.9%). Its TVL fell less than ETH itself (-16.0%), which suggests deposits largely stayed put, although the figure mixes ETH-denominated assets and stablecoins. Solana's TVL fell 15.5% to $5.4 billion, roughly in line with SOL's price.
Two chains grew: Arbitrum (+1.3% to $1.44 billion) and Robinhood Chain (+6.8% to $1.09 billion). Robinhood Chain gaining TVL in a falling market is notable. Monad gave back 14.5%.
On-chain trading: DEX volume down 17%
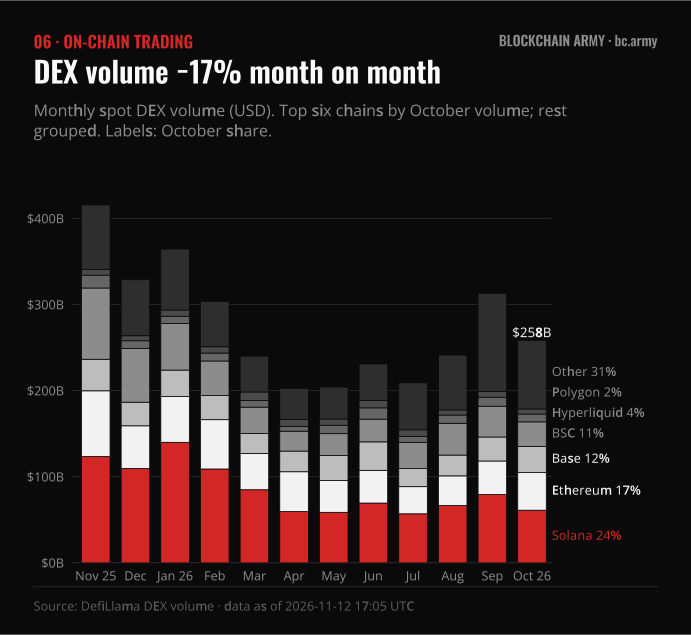 Source: DefiLlama, data as of 2026-11-12 17:05 UTC
Spot DEX volume was $258.3 billion in October, down 17.4% from September and 37.8% below November 2025. The breakdown by chain matters more than the total. Solana is still the largest venue ($61.0 billion, 23.6% share), but its volume fell 23.0% as memecoin and launchpad activity cooled. Ethereum mainnet (+12.5% to $43.8 billion) and Base (+9.0% to $30.4 billion) were the only large chains to grow. BSC fell 20.6% and Hyperliquid's spot venues fell 12.7%.
This rotation fits the rest of the data. In risk-off months, flow tends to move toward deep liquidity: blue-chip pairs, stablecoin swaps and venues where institutions are comfortable. The long tail loses volume first.
Cash flows: who actually earned
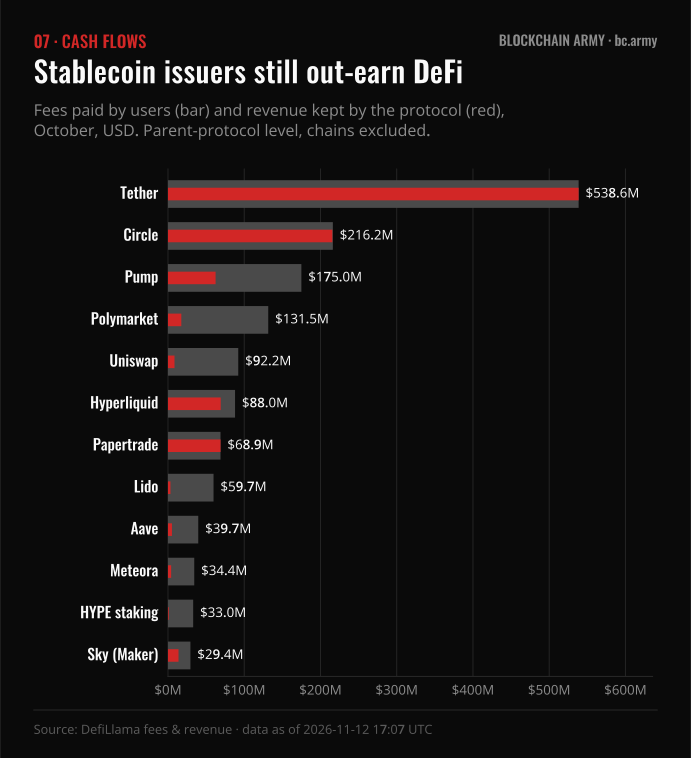 Source: DefiLlama, data as of 2026-11-12 17:07 UTC
| # | Protocol | Fees (Oct) | Revenue (Oct) | Revenue / fees |
|---|---|---|---|---|
| 1 | Tether | $538.6M | $538.6M | 100% |
| 2 | Circle | $216.2M | $215.5M | 100% |
| 3 | Pump | $175.0M | $62.4M | 36% |
| 4 | Polymarket | $131.5M | $17.4M | 13% |
| 5 | Uniswap | $92.2M | $8.5M | 9% |
| 6 | Hyperliquid | $88.0M | $69.1M | 79% |
| 7 | Papertrade | $68.9M | $68.9M | 100% |
| 8 | Lido | $59.7M | $3.2M | 5% |
| 9 | Aave | $39.7M | $5.2M | 13% |
| 10 | Meteora | $34.4M | $4.1M | 12% |
The two largest stablecoin issuers earned $754.8 million in October between them, more than the next eight protocols combined. Their income comes from Treasury-bill yield on reserves, so it depends on interest rates more than on crypto activity. A Fed that is talking about hikes is good for that business.
Among applications, the gap between fees and revenue shows who captures value. Hyperliquid kept 79% of its $88.0 million in fees. Uniswap passed 91% of its fees through to liquidity providers. Polymarket ($131.5 million in fees) remains one of the few consumer applications whose activity does not depend on token prices.
Exchange reserves: Binance after the exploit
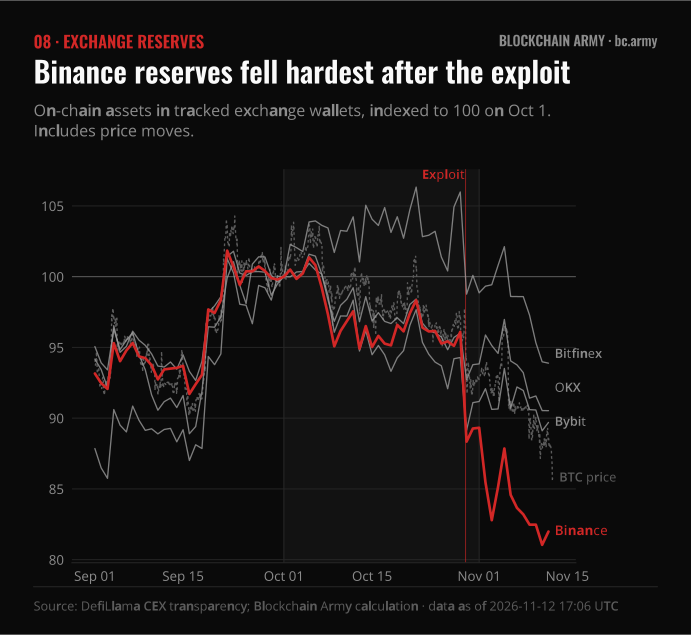 Source: DefiLlama CEX transparency, Blockchain Army calculation, data as of 2026-11-12 17:06 UTC
DefiLlama tracks exchange-owned wallets on-chain. We indexed each exchange to 100 on October 1 and plotted Bitcoin's price as a reference line, because these balances move with prices. Before October 29, Binance moved in line with its peers. In the daily window containing the exploit, Binance's tracked assets fell from $144.9 billion to $133.2 billion (-8.1%), while Bitcoin fell 4.2% and the other exchanges fell 3.4-6.8%. Binance ended the month 10.7% below its October 1 level, against -6.2% for OKX, -8.8% for Bybit and -1.1% for Bitfinex.
Binance's response limited the damage. The exchange said it had reserved more than $6.34 billion of its own funds to cover losses, and industry partners froze about $3 billion of the stolen assets (Cointelegraph). Withdrawals reopened in phases on November 1. Users pulled a net $3.64 billion in the first nine hours, which Binance put at 2.1% of its assets, and the FBI attributed the attack to North Korea's TraderTraitor group (Bankless). A new zero-knowledge proof-of-reserves snapshot followed (The Block). Even so, tracked Binance assets have kept falling into November, to $123.6 billion on November 12.
Key takeaway: Binance covered the hack quickly, so this was not a solvency event. But it was a trust event, and the slow, continued decline in on-chain balances is how that shows up in the data.
Bitcoin network: hashrate up, fees near zero
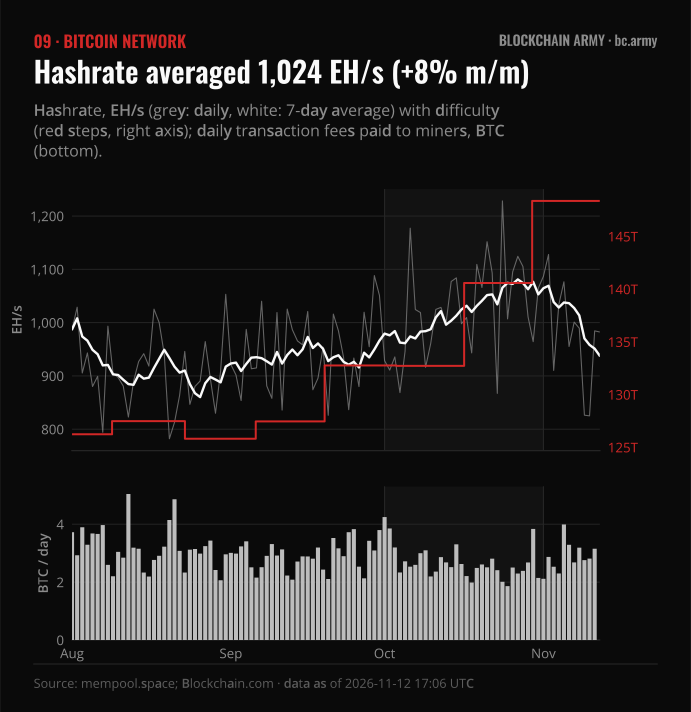 Source: mempool.space and Blockchain.com, data as of 2026-11-12 17:06 UTC
Miners kept adding capacity while the price fell. Hashrate averaged 1,024 EH/s in October, up 8.4% from 944 EH/s in September. Difficulty barely moved on October 3 (-0.03%), then rose 5.92% on October 16 and 5.54% on October 29, to 148.36T. Fees paid to miners came to only 82.85 BTC for the whole month (about $7.2 million), or 2.7 BTC a day. Block space demand remains very low.
Higher difficulty, a lower price and almost no fee income all push down miner revenue per unit of hashrate. Simple Mining puts October's average hashprice at $37.92 per PH/s per day, down 3.7% from September. Miners are still adding capacity anyway, and for many of them AI and HPC hosting is now a second line of business. TeraWulf, for example, doubled the contracted capacity at its Muskie campus to 1 GW.
Sentiment: greed to fear in a single print
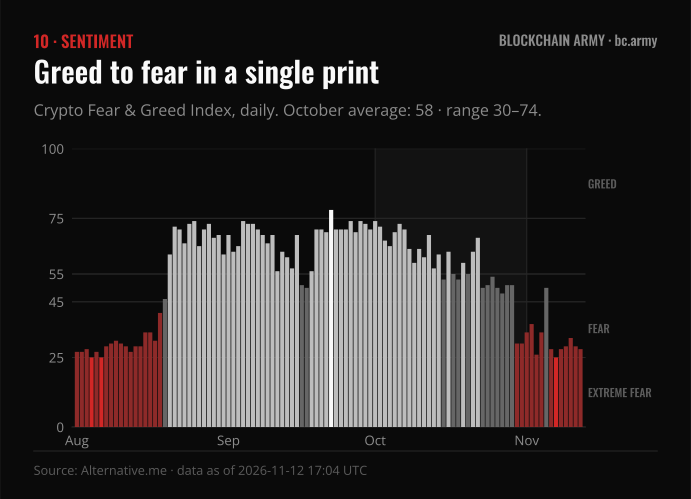 Source: Alternative.me, data as of 2026-11-12 17:04 UTC
Sentiment is the clearest example of how the month unfolded. The Fear & Greed Index opened October at 74 (greed) and drifted down to about 50 as prices bled, but it did not register fear until the exploit. It read 51 on October 29 and 30 the next day. The October average was 58.5, and only two days of the month were below 45. In November the index has stayed between 25 and 37 on most days. It read 28 on November 12.
Ether supply: steady inflation, one burn spike
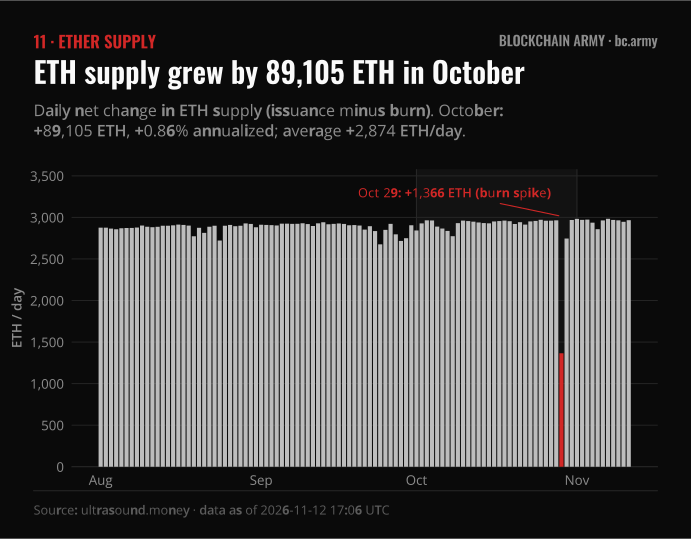 Source: ultrasound.money, data as of 2026-11-12 17:06 UTC
ETH supply grew by 89,105 ETH in October, an annualised rate of 0.86%, averaging about 2,874 ETH a day. One day stands out: on October 29, net issuance fell to 1,366 ETH. The burn spike coincided with the exploit and the volatility around it, when on-chain demand for block space jumped. Apart from that day, the burn did little to offset issuance. Until sustained on-chain demand returns, Ether is a modestly inflationary asset.
What we're watching in November
This section lists signals we are monitoring. It is not a forecast.
- Binance's on-chain balances and laundering flows. Whether tracked reserves stabilise after the withdrawal wave, how much of the roughly $3 billion frozen is recovered, and how the stolen funds keep moving across chains.
- Stablecoin net issuance. USDT has shrunk by another $4 billion since October 31. A turn back to net minting would be the first liquidity signal worth noting.
- Macro calendar. The October CPI report, and how markets price the December 8-9 FOMC meeting after two officials voted for a hike in October.
- ETF flows. Whether IBIT keeps taking in money while the rest of the spot Bitcoin ETF complex sees net redemptions, as it did in October.
- Index rules for treasury companies. MSCI's new non-operating-company methodology applies from the November index review (The Block). Any exclusions could affect demand from Bitcoin treasury companies.
- US market structure legislation. The CLARITY Act failed a Senate procedural vote on September 15 (Orrick). We are watching the post-election Senate calendar for any sign that it returns.
- Miner economics. The next difficulty adjustments, and whether low fees and lower hashprice start to slow hashrate growth.
Methodology and sources
- Returns. CoinGecko daily prices at 00:00 UTC. The monthly return is the price at 00:00 UTC on October 1 against 00:00 UTC on November 1, and weekly columns use the same convention. "Close" refers to the 00:00 UTC print of the following day.
- Asset universe. The 20 largest assets by market cap on October 1, after removing stablecoins, tokenised gold, wrapped, bridged and liquid-staking tokens, and any asset whose price varied by less than 2% over the period (pegged or yield-bearing wrappers).
- Sector baskets. The eight largest eligible assets in each CoinGecko category, weighted by market cap on October 1. Categories overlap (for example, HYPE appears in DeFi, Layer 1 and Exchange tokens), so baskets are not mutually exclusive.
- Stablecoins, TVL, DEX volume, fees and exchange reserves. DefiLlama public endpoints. TVL and reserves are in USD and include price effects. Fees are grouped at parent-protocol level; chains, MEV searchers and block builders are excluded. Exchange reserves cover only the wallets DefiLlama attributes to each exchange, not total liabilities. Bitget was left out because its tracked balance is too noisy day to day.
- Bitcoin network. Hashrate and difficulty from mempool.space; daily miner fees from Blockchain.com.
- ETH supply. Daily supply from ultrasound.money; net change is the difference between consecutive 00:00 UTC readings.
- ETF flows and events. We could not pull daily ETF flow data from a public, keyless source (Farside blocks automated requests), so ETF figures are quoted from the cited reports rather than charted. Event annotations come from the news sources linked in the text.
- As-of time. All data was pulled on 2026-11-12 between 16:38 and 17:08 UTC. Market snapshot at the time of writing: total crypto market cap $2.42 trillion, Bitcoin dominance 59.6% (CoinGecko).
All charts are original Blockchain Army work, generated from the raw data by our own pipeline. The underlying numbers are published alongside the charts for reproducibility. This report is for information only and is not investment advice.
Need this kind of on-chain intelligence for your own token or protocol? Blockchain Army builds custom analytics dashboards that turn raw chain data into decisions.
Sources
- CoinGecko - prices, market caps and categories (public API)
- DefiLlama - stablecoins
- DefiLlama - chain TVL
- DefiLlama - DEX volume
- DefiLlama - fees and revenue
- DefiLlama - CEX transparency
- mempool.space - hashrate and difficulty
- Blockchain.com - transaction fees
- ultrasound.money - ETH supply
- Alternative.me - Crypto Fear & Greed Index
- Cointelegraph - Recap: how Binance's record $6.3B hack unfolded
- Cointelegraph - Bitcoin risks worst October in 12 years as tech sell-off spreads to gold
- Bankless - Binance reopens withdrawals, FBI pins hack on North Korea
- The Block - Binance completes latest proof of reserves after record hack
- Simple Mining - Bitcoin market report, October 2026
- Crypto Briefing - Bitcoin ETFs log $228M in weekly sales as monthly outflows near $618M
- Cointelegraph - Ether ETF outflows near $1.1 billion in October
- Decrypt - Bitcoin falls as hot inflation puts a Fed hike back on the table
- investingLive - FOMC decision, October 28
- The Block - MSCI finalizes index rules that put Strategy, crypto treasury firms at risk of exclusion
- Orrick - The CLARITY Act stalls in the Senate
How we research, write and fact-check: Editorial & AI policy.
Disclaimer: this article is for informational and educational purposes only and does not constitute financial, investment, legal or tax advice. Crypto-assets are volatile and high-risk: always do your own research (DYOR) and consult a qualified professional before making any decision. Not financial advice.